ARTICLES
Category:
Paid Ads Strategy
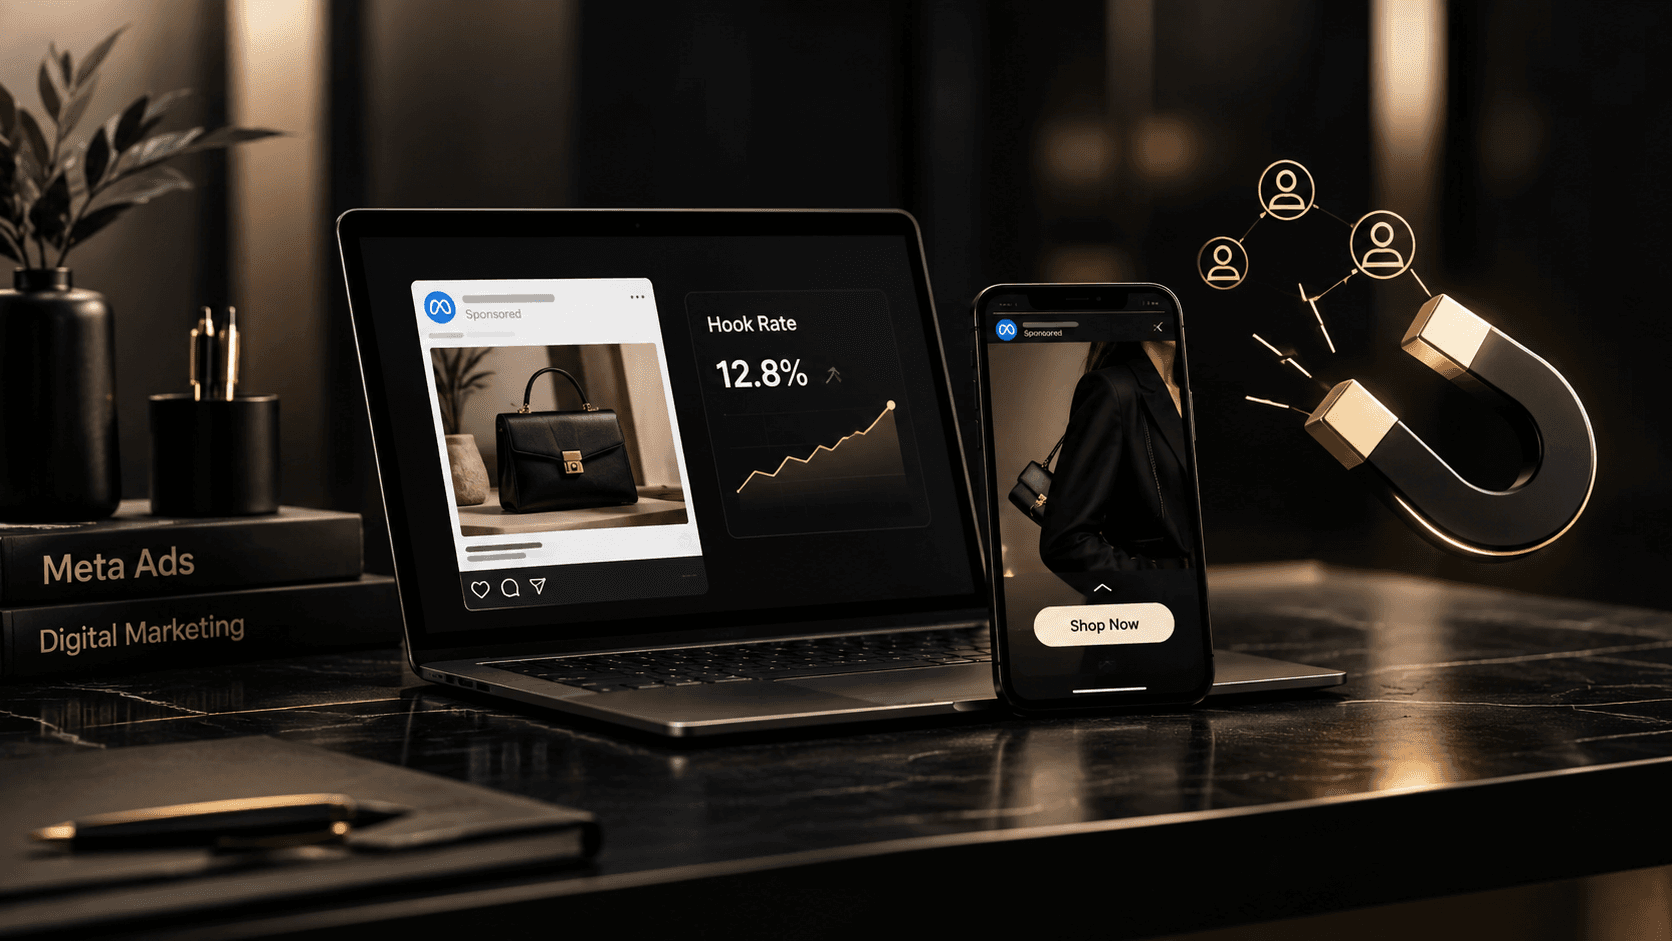
Hook rate is the share of ad impressions that turn into a 3-second video view: 3-second video plays ÷ impressions × 100. Across 88,329 Meta video ads in H1 2026, the average was 25.44%. Apparel and accessories averaged 22.94%, below the cross-industry line every month, so fashion brands should benchmark against their category.
Hook rate is the first number we check when a video ad won't spend or won't sell. If people don't stop, nothing after second three matters: not the product, not the offer, not the edit. Veicolo's creative team has launched more than 120,000 performance creatives for fashion and luxury brands, and the opening is the part we test hardest because every metric downstream depends on it.
This guide covers the formula, how to add hook rate to Ads Manager, 2026 benchmarks with the fashion number most guides leave out, how to read it alongside hold rate, and nine fixes that work on apparel specifically.
What is hook rate in Facebook and Instagram ads?
Hook rate measures how often your video ad stops the scroll. It is the percentage of impressions where someone watched at least three seconds. Some teams call it thumbstop ratio or thumbstop rate; the formula is the same.
It is a video-only metric. Meta counts a 3-second video play only on video ads, so static images and most carousels have no hook rate. For those formats, use outbound CTR as the stop signal instead.
Hook rate matters for two reasons. First, it isolates the opening of the ad. When an ad underperforms, you need to know whether people never stopped or stopped and then left. Hook rate answers the first question on its own. Second, a weak opening starves the rest of the ad of attention. A video that only holds 15% of impressions for three seconds has a much smaller audience left to see the product, the proof and the offer than one that holds 30%.
What it does not measure is persuasion. A shocking opening can stop the scroll and still sell nothing. Treat hook rate as a diagnostic for the first three seconds, then judge the ad on cost per purchase and contribution margin. We cover how to combine the two further down.
How to calculate hook rate (formula and Ads Manager setup)
Hook rate = (3-second video plays ÷ impressions) × 100
Example: an ad served 48,000 impressions and logged 11,520 3-second video plays. 11,520 ÷ 48,000 = 0.24, so the hook rate is 24.0%.
Ads Manager does not show hook rate by default. Add it once as a custom metric and it is available in every report:
In Ads Manager, open Columns, then Customize columns.
Select Create custom metric.
Name it "Hook rate".
Build the formula: 3-second video plays ÷ Impressions.
Set the format to Percentage and save.
Repeat for hold rate: ThruPlays ÷ 3-second video plays, also formatted as a percentage.
Save the column set as a preset (we call ours "Creative diagnostics") with spend, impressions, hook rate, hold rate, outbound CTR, cost per purchase and purchase ROAS side by side.
Two habits make the number more useful. Break results down by placement, because Reels, Feed and Stories audiences behave differently and a blended hook rate can hide a weak placement. And compare ads only after each has enough delivery: Billo's 2026 benchmark excluded ads with fewer than 1,000 impressions, which is a sensible minimum before reading anything into the number.
Hook rate benchmarks for 2026 (and where fashion sits)
The most useful public dataset this year comes from Billo, which analyzed 88,329 Meta video ads from sales-objective campaigns running January 1 to June 30, 2026, covering $122 million in spend across 14 industries (Billo, H1 2026). The cross-industry average hook rate was 25.44%, up from 24.42% in H2 2025.
Industry (Meta video ads, H1 2026) | Average hook rate |
|---|---|
Toys & Games | 28.79% |
Business & Industrial | 28.74% |
Health & Beauty | 28.11% |
Sporting Goods | 26.89% |
Cross-industry average | 25.44% |
Apparel & Accessories | 22.94% |
Animals & Pet Supplies | 21.32% |
Two details matter for fashion brands. Apparel and accessories sat below the cross-industry average in all six months, so the gap is structural, not seasonal. And the spread between the best and worst industries was 7.47 percentage points, which means comparing your apparel account to a generic "good hook rate" figure will make healthy ads look broken. Motion's glossary describes 20% to 40% as generally solid (Motion), a wide band that most apparel ads sit at the bottom of.
Here is how we suggest fashion brands read their own number, anchored to the 2026 data:
Your hook rate | What it means for a fashion brand | What to do |
|---|---|---|
Under 20% | Below every industry average in the dataset | Rework the first frame before spending more |
20% to 23% | Around the apparel average | Normal; test new hooks before scaling |
23% to 28% | Above apparel, near or above cross-industry | Strong for the category; scale if CPA holds |
Over 28% | Level with the top industries | Protect the hook; iterate on body and offer |
Want to see how we turn these numbers into a testing roadmap? Our ad creative testing process runs hooks as a separate variable, so you learn which opening works before you pay to scale it.
Why fashion ads run below the hook rate average
The Billo dataset tells us apparel underperforms; it doesn't say why. From reviewing creative across fashion accounts, these are the patterns we see most often in ads that sit under 20%.
Editorial pacing. Brand teams and photographers are trained for the lookbook, not the feed. Slow pans, a logo card in the first second, a model who walks into frame at second two. All of it looks beautiful and all of it wastes the only three seconds that count.
Product without a body. Flat lays and packshots answer "what is it" but not "is it for me". Clothing is judged on a person: how it moves, falls and fits. When the first frame is a hanger, the shopper has no reason to stay.
Category sameness. Fashion feeds are full of near-identical try-ons in white rooms. When every ad opens on the same shot, none of them interrupts the scroll.
Repurposed footage. Campaign film shot for 16:9 and cropped to 9:16 often loses the face or the garment off the edge of the frame. The first frame ends up as a torso or a wall.
No message without sound. Music-only edits with no on-screen text say nothing to the shopper watching on mute in Feed.
None of these are fixed by "better creative" in the abstract. They are fixed by specific changes to the opening, which is what the next two sections cover.
Hook rate vs hold rate: read them together
Hold rate measures what happens after the stop. Most teams define it as ThruPlays ÷ 3-second video plays (a ThruPlay is a play to completion or 15 seconds, whichever comes first). Hook rate tells you whether people stopped; hold rate tells you whether the ad kept them.
Hold rate depends heavily on video length, so a cross-industry benchmark is less useful than your own account median. Compare every ad to the median hook rate and hold rate of the ads that spent in the last 30 days, and each ad falls into one of four boxes:
Hold rate above your median | Hold rate below your median | |
|---|---|---|
Hook rate above your median | Scale candidate. Check CTR and cost per purchase, then raise budget. | The opening over-promises. Keep the hook, rebuild seconds 3 to 10 so the body pays it off. |
Hook rate below your median | Good ad, weak opening. Keep the body and test 3 to 5 new hooks on it. | Concept problem, not a hook problem. Retire it and brief a new angle. |
9 ways to raise hook rate on fashion ads
1. Put the garment on a moving body in frame one
Open on a person wearing the product, mid-movement: walking toward the camera, turning, sitting down, pulling on a jacket. Motion is what the eye catches in a feed of still images, and a body answers the fit question immediately. If your best footage starts with an establishing shot, cut it and start on the movement.
2. Show the result before the process
Lead with the finished look, then explain how you got there. "One dress, three ways" should open on the most striking of the three, not on the dress on a hanger. Outfit reveals, before-and-after styling and transformation edits all work because the payoff is visible before the shopper decides to scroll.
3. Open on a face that talks to the camera
A person making eye contact and speaking in the first second reads as a message meant for the viewer, not an ad. TikTok's own creative guidance reports that 33% of the auction ads with the highest view-through rate break the fourth wall by addressing the viewer directly (TikTok Ads). The same principle holds on Reels.
4. Land the product and the message inside three seconds
TikTok found that over 63% of its highest-CTR videos highlight the key message or product within the first three seconds (TikTok Ads). For a fashion ad, that means the shopper should know what you sell and why it is different before second three: the fabric, the fit, the price point or the occasion.
5. Write a text hook that names the shopper's question
Fashion shoppers scroll with specific doubts: will it fit, is it see-through, what do I wear it to. A text overlay that names one of them stops the right person. "5'2"? This is the 27-inch inseam." "The wedding guest dress that survives a dance floor." TikTok reports that 40% of its highest-VTR auction ads use text overlays (TikTok Ads).
6. Build the first frame for sound off, then add sound for Reels
Feed placements are often watched on mute, while Reels and TikTok are sound-on environments. Make the first frame work silently with on-screen text and captions, then add a voiceover or a track that rewards the viewer who turns sound on. One edit with captions covers both.
7. Mix creator footage with studio content
Phone-shot creator content looks native in the feed and often out-hooks polished studio film on the same product. That doesn't mean dropping brand standards: the best fashion accounts run both, using studio assets for brand moments and UGC ads for the try-on, the honest review and the fit demo.
8. Crop for 9:16 first and keep the product in the safe zone
Shoot or edit vertical first. Keep the face and the garment in the center of the frame, clear of the caption, profile and button overlays at the top and bottom of Reels and Stories. A hook that is technically there but hidden under the interface does not count.
9. Test hooks as a variable, not as whole new ads
Winners are rare. Motion's 2026 benchmark of 578,750 creatives across 6,015 accounts found that roughly 5% qualify as winners, defined as spending at least 10 times the account median (Motion). The cheapest way to find one is to keep a proven body and swap only the first three seconds: three to five hook variants per concept, launched together. That is how our team works across 120,000+ creatives, and it is the core of how we run performance creative strategy for fashion brands.
What hook rate can't tell you
A high hook rate is a good start, not a result. Three checks keep it honest.
Check CTR next. A hook that stops people with something unrelated to the product (a shock line, a trend sound, a meme) can post a strong hook rate and a weak outbound CTR. If hook rate is above your median and CTR is below it, the opening is attracting the wrong attention.
Judge the ad on money, not attention. The ad that wins is the one that buys customers below your break-even cost. Hook rate can't tell you that. Compare cost per purchase and ROAS to your break-even ROAS, which for fashion brands is usually higher than founders expect once returns and discounts are counted.
Don't read it too early. Below roughly 1,000 impressions, a few views either way swing the percentage by points. Let ads deliver before you kill or crown them.
If ROAS is the number that is slipping, our guide to improving ROAS in online fashion advertising covers the levers beyond creative, and our breakdown of what makes a strong hook has script examples you can brief straight to an editor.
Frequently asked questions
What is a good hook rate for Facebook ads?
Across Meta video ads in H1 2026, the average hook rate was 25.44%. For fashion, the better benchmark is the apparel and accessories average of 22.94%. Above 25% is strong for a fashion brand; under 20% means the first frame needs work before you add budget.
How do you calculate hook rate?
Divide 3-second video plays by impressions and multiply by 100. In Meta Ads Manager, create a custom metric with the formula 3-second video plays ÷ impressions and format it as a percentage so it appears in every report.
What is the difference between hook rate and hold rate?
Hook rate measures how many impressions became a 3-second view. Hold rate measures how many of those viewers kept watching, usually calculated as ThruPlays ÷ 3-second video plays. Hook rate diagnoses the opening; hold rate diagnoses the body of the ad.
What is a good hold rate for Facebook ads?
There is no reliable cross-industry hold rate benchmark because it depends heavily on video length. Compare each ad to the median hold rate of ads in your account that spent in the last 30 days, and test shorter edits if most of your ads sit below it.
Is hook rate the same as thumbstop ratio?
Yes. Thumbstop ratio, thumbstop rate and hook rate all describe the share of impressions that turn into a 3-second video view. Use one name consistently across your reports so the team compares like with like.
Does hook rate apply to static image ads?
No. Meta only records 3-second video plays on video ads, so static images have no hook rate. Use outbound CTR and cost per purchase to judge statics, and convert your best static concepts into short video to test the hook.
Get a creative audit from the team behind 120,000+ fashion ads. We'll review your top-spending Meta ads, show you where the opening is costing you, and map the next round of hook tests. Book your Growth Audit.
Featured Case Study


304 %
Scaled Revenue MoM

4x ROAS
consistently over 6 months

125 %
YoY Meta Spend Growth


304 %
Scaled Revenue MoM
OUR APPROACH
Turning Performance Data
Into Profit Clarity
1. Profit-First Measurement
We start where most growth strategies stop: profit. Campaigns, channels, and products are evaluated against margin, contribution, and cash flow—not surface metrics.
2. Marketing Connected to the P&L
Performance data only matters when it maps to financial reality. We align ad spend, customer acquisition, inventory, and lifecycle value into a single decision-making system.
3. Continuous Financial Optimization
Growth isn’t a one-time model. We monitor performance as conditions change—traffic mix, demand, costs—so decisions stay profitable as you scale.




Want to get similar results?
Our Impact,
By The Numbers
RELATED ARTICLES